Alternative Insight
Gross Attention
to the Gross Domestic Product
Prepared by the Bureau
of Economic Analysis of the Department of Commerce, the Gross
National Product (GDP) serves primarily as an accounting function
for the United States government -- one statement in a
description of national accounts. By summarizing the monetary
value and sources of services and production, the GDP reports
all expenditures in the U.S. economy. Anxiously awaited, the
economic statistic is employed to indicate and forecast the health
of an economy. However, the GDP tends to be misinterpreted, ambiguously
defined, and improperly used. Is there more to its well arranged
numbers than invigorating government officials and encouraging
investors?
Definition
The more accepted definition of Gross domestic product (GDP) has it as the “monetary value of all the finished goods and services produced within a country's borders in a specific time period,” usually annually. The production of goods and services includes the sum of private and public consumption, government purchases, capital investments, and the trade balance, which is the difference between exports and imports.
GDP is calculated from GDP = C + G + I + NX, where C is consumption of goods and services, G is government spending, I is capital investment, and NX is the trade balance.
A typical preparation of GDP by Bureau of Economic Analysis (BEA) is shown below.
|
FIGURE 1 |
Gross Domestic Product |
|
|
[Billions of dollars] Seasonally adjusted at annual rates |
2014 |
2016 |
|
Gross domestic product |
17025.2 |
18675.3 |
|
Personal consumption expenditures |
11636.1 |
12832.2 |
|
Goods |
3900.8 |
4111.9 |
|
Durable goods |
1256.3 |
1414 |
|
Nondurable goods |
2644.5 |
2697.9 |
|
Services |
7735.3 |
8720.3 |
|
Gross private domestic investment |
2774 |
3017.2 |
|
Fixed investment |
2738.6 |
3013.1 |
|
Nonresidential |
2194.5 |
2313.8 |
|
Structures |
518.1 |
500.5 |
|
Equipment |
1011.6 |
1049.3 |
|
Intellectual property products |
664.7 |
763.9 |
|
Residential |
544.1 |
699.3 |
|
Change in private inventories |
35.4 |
4.1 |
|
Net exports of goods and services |
-508.4 |
-460 |
|
Exports |
2339.1 |
2276.3 |
|
Goods |
1593.5 |
1495.4 |
|
Services |
745.6 |
780.9 |
|
Imports |
2847.4 |
2736.2 |
|
Goods |
2369.1 |
2222.7 |
|
Services |
478.3 |
513.5 |
|
Government consumption expenditures and gross investment |
3123.6 |
3285.9 |
|
Federal |
1218.1 |
1251.8 |
|
National defense |
750 |
736 |
|
Nondefense |
468 |
515.8 |
|
State and local |
1905.5 |
2034.1 |
Analyzing the GDP
data discloses discrepancies
According to the BEA, “because
there is no market value for what the government produces, in
the case of government wages, we measure the value of government
output based on the input costs, which wages are a part of.”
The BEA wisely does not include transfer payments (Social Security,
welfare, unemployment compensation) in GDP calculations. However,
government wages, because it is eventually used for purchasing
goods and services, becomes included in personal consumption
expenditures and iadded to the GDP as a service component under
government expenditures. These wages are not double bookkeeping,
but their service component leads to contradictions:
(1) Government wages are paid from transfer of personal income taxes, which means expenditures on goods and services remain relatively constant; just a different group spends for the goods and services By adding the employment to a government expenditure for services, the GDP is increased without an increase in industrial production. Vice-versa, lowering taxes might lower total government wages and the bookkeeping services and therefore decrease GDP, which contradicts a supposition that lowering taxes will increase consumption and GDP.
(2) Increased government bureaucracy, which adds nothing to the economy, can be used to increase GDP.
(3) The assertion, attributed to John Maynard Keynes’s, that hiring workers to produce useless goods (become buried) will invigorate the economy is dubious. These wages, if paid from deficit spending, will augment purchasing power and demand for which there are no added goods and either procure a remaining surplus or inflate prices. The economy will remain stagnant and the increased GDP will be misleading.
The statistic that is most inappropriate and has led to an invalid interpretation to the U.S. economy is that for services. From the Table, personal services contribution to GDP is more than twice that of manufactured goods, which has prompted a supposition that the U.S. has been transformed from an industrial economy to a service economy. The data demonstrates the assumption is incorrect and the manufacturing sector is vibrant.
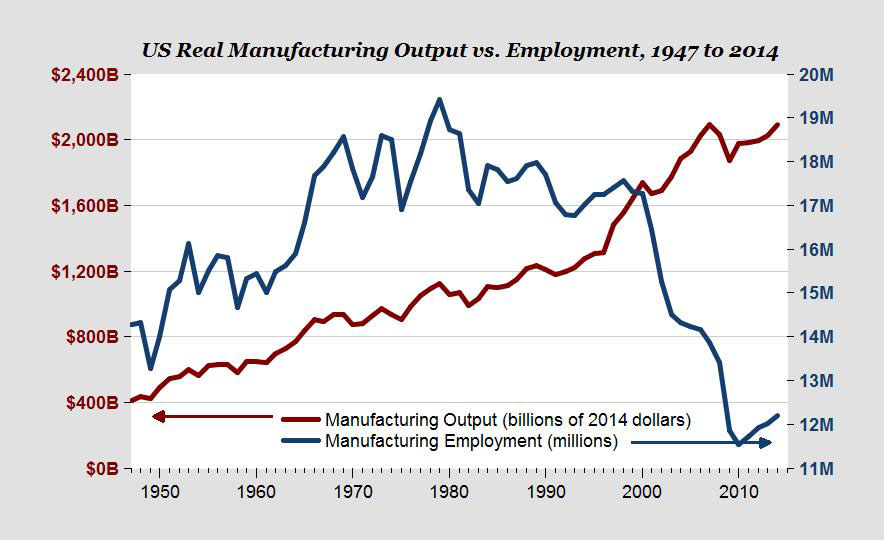 FIGURE 2: Real MFG Output
Source: www.aei.org
As shown in the chart, U.S. manufacturing has steadily increased
for decades. During the Reagan administration, manufacturing
employment reversed an upward trend and decreased. This decrease
accelerated during the George W. Bush Presidency. In both the
Clinton and Obama administrations, manufacturing employment remained
relatively constant; one consideration being that these administrations
did not suffer from recessions.
The primary reason for manufacturing employment decline is undoubtedly
due to the increase in efficiency of industrial production, especially
the introduction of computers and software to replace clerical
functions and automation with robotics to replace factory workers.
Use of foreign contractors and transfer of manufacturing to foreign
sources has restrained manufacturing growth, raised profits,
and shifted capital to newer industries, but has not halted a
positive trend in domestic value added to manufacturing.. Note
that the slope of the manufacturing curve actually increased
after 1980, a year in which outsourcing began to become more
predominant in the U.S. industrial economy.
Figure 3 depicts rapid productivity gains in the last two decades -- about 100% in real time output per worker.
FIGURE 3: Output
per Worker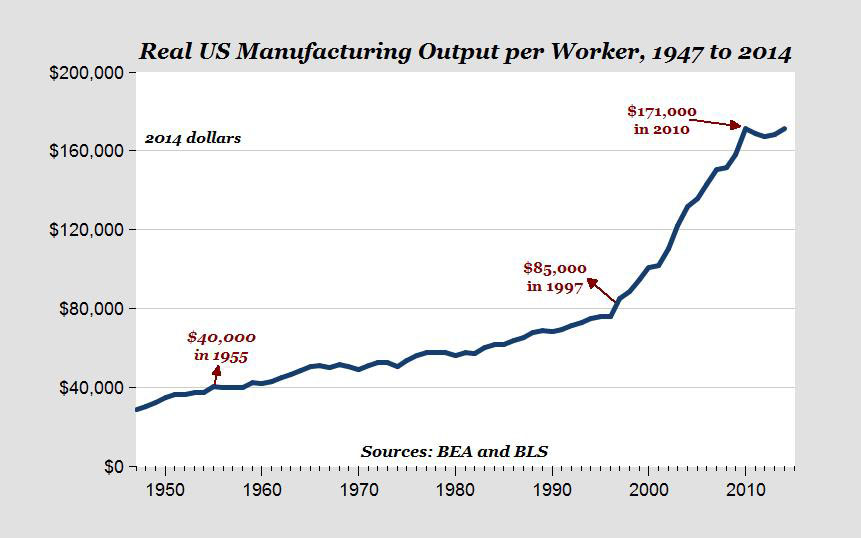
Source: www.aei.org
Using productivity gains to increase output, has forced an increase
in advertising, retail outlets and transport services to market
the additional products. Increased production has resulted in
reduced manufacturing employment (an anomaly, which is more pronounced
in the highly mechanized agricultural sector) and an increase
in lower waged service jobs. Figures 4 demonstrates that the
increase in retail trade employment matched the decrease in manufacturing
jobs, before leveling off in recent years, probably due to online
purchasing.

Figure 5 shows the top U.S. employers are engaged in the service industry of retail sales.
|
Employer |
Federal Government |
Wal-Mart |
McDonald's |
Kroger |
IBM |
Home Depot |
Target |
|
Employees |
2,711,000 |
1,300,000 |
420,000 |
400,000 |
377,757 |
371,000 |
347,000 |
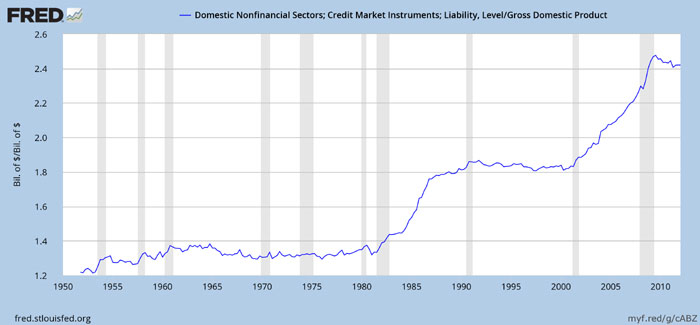
Increasing production and sales (in manufacturing and agriculture), while maintaining prices constant and reducing the overall wage bill, increases GDP and profits, which raises the question, “If productivity generates layoffs and layoffs reduce purchasing power, from where does the purchasing power come?” The answer: It comes from increased debt, and, unless savings, retained earnings, or added exports are used to clear the market, GDP cannot be increased without increasing the debt. Figure 6 corroborates this assertion 6 since 1980, the beginning of the Reagan administration, total domestic debt has grown faster than GDP. Note that domestic debt to GDP grew at the same rate during the Clinton administration and the ratio decreased during the Obama administration. During the latter, government debt filled the purchasing power gap.
All is not as dismal as seems -- domestic debt is backed by assets, and total assets far exceed total debt. However, increases in GDP in the last decades do not mean the public has benefited from the elevated GDP; just the opposite, the public might gain more from a stagnant GDP. How can this happen?
If, instead of maintaining prices for increased production resulting from productivity gains, what if corporations lowered prices? Obviously, their total sales income and profits would be lessened, and the manufacturing contribution to GDP would not exhibit much increase. However reduced prices would enable more of the public to purchase goods at a faster rate, and borrowing required to purchase the additional manufactured goods would decrease. GDP might remain stagnant, and corporations might show less profit gains, but wealth will be better distributed, exports might increase, and economic health of the nation will be reinforced.
Another reason for the increase in the service sector is that after wage earners satiate on consumer goods, they have surplus income to purchase services
If a factory worker purchases a service, such as medical, and the medical practitioner uses that income to purchase another service, such as auto repair, and the garage mechanic uses that income to purchase another service, such as a meal in a restaurant, and the waiter uses that income to purchase a coat, the original worker’s spending has been transformed into several additions to the GDP. The total contribution is restrained by the velocity of money and taxes. The contribution is erratic and can be huge.
The contribution of the goods sector to GDP is well defined; spending on goods does not escalate into additional spending on goods, it only provides a return of financial assets for another round of manufacturing production.
Other Exaggerations
Defense manufacturing is a major
contribution to GDP. Purchases of production of new aircraft,
new naval vessels, and new armaments add substantial numbers
to GDP, but do not represent standard manufacturing and artificially
inflate the GDP magnitude.
Goods production is used and consumed, has a definite shelf life and enriches quality of life. Defense production is less used, has an arbitrary shelf life and does not enrich quality of life. Defense production has a purpose, a worthwhile purpose, but its production is similar to “bury it in the ground” type of production. All nations desire security and have defense budgets, which is an acceptable practice. Because the U.S. defense budget of about $600 million, which may be necessary, is equivalent to the sum of the next seven largest military budgets in the world, defense skews the U.S. GDP more than defense budgets do for other nations.
Repair, reconstruction and new construction of infrastructure and buildings have value added that contains value destroyed. As an example, tear down a building, or bridge, or fence before constructing its replacement and the labor and machinery used for the shredded structure appear in the cost and value of the new structure. Because renovation of U.S. aging infrastructure requires much “tearing down” before “building up,” the construction process may tend to elevate the GDP, and distort its comparison with nations that are mostly introducing new infrastructure. A more realistic reflection of the actual addition to the nation’s assets would be to add to the GDP only the difference in real value between the old and new structures.
Trade Balance
De-emphasized by several economic schools, the most predominant
being Modern Monetary Theory, the trade balance’s direct
effect on the GDP also directly affects the economy. Re-circulation
of the trade deficit into purchase of domestic debt and or national
assets may seem to sooth the problem but not without cost. At
a later reckoning time, the former must be repaid and, unlike
domestic repayments, international repayments translate into
a loss of patrimony, either monetary or hard assets, sooner or
later it amounts to selling the store.
GDP Expressions
GDP raw does not consider inflation
and is not an accepted method for presenting GDP.
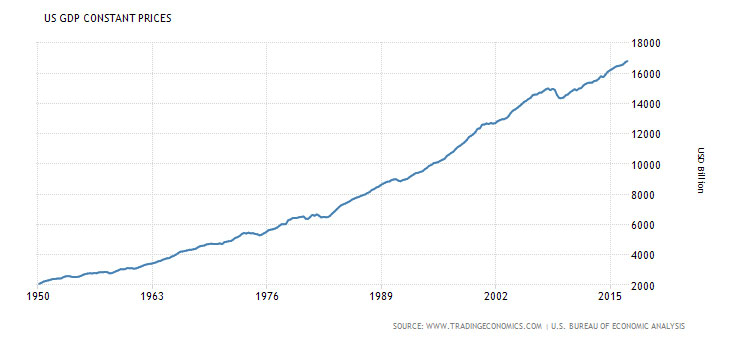
GDP at constant prices (relative to a specific year) is
the more reliable presentation of GDP, except that the selection
of a breadbasket and uncertainty of accurate numbers for product
prices complicates the calculation of constant prices.
GDP per capita is used mainly for comparison of GDP between
nations.
GDP per capita PPP (purchasing power parity ) is also
used for comparison of GDP between nations and considers the
differences in prices and purchasing power (not totally accurate)
of consumers in different nations.
Conclusions
(1) The GDP is one part of a general
accounting statement and its use for accurately determining the
wealth and health of the nation is subject to challenge.
(2) GDP numbers substantiate the thesis that manufacturing
in the United States is still robust and growing.
(3) GDP statistics indicate that the decline in
manufacturing employment coincides with a rise in credit outstanding.
These coincidental phenomena have occurred almost entirely during
Republican administrations.
(4) The absolute number of personal expenditures
for goods is more important than the ratio of this expenditure
to overall GDP.
(5) As long as manufacturing is increasing, the
service sector is not a driver of the economy and a benefactor
of a robust goods economy.
(6) Employment, manufacturing, credit outstanding,
balance of payments, and distribution of wealth are factors that
analyzed together allow a more capable determination of the economy’s
direction than the GDP number.
(7) Analysis does not vindicate the proposition
that lowering taxes increases GDP and enhances prosperity; just
the opposite
(8) GDP plays a role in the electoral process. History
indicates that if GDP rises before an election, the incumbent
Party almost always wins. If the GDP decreases, then the contending
Party wins the election
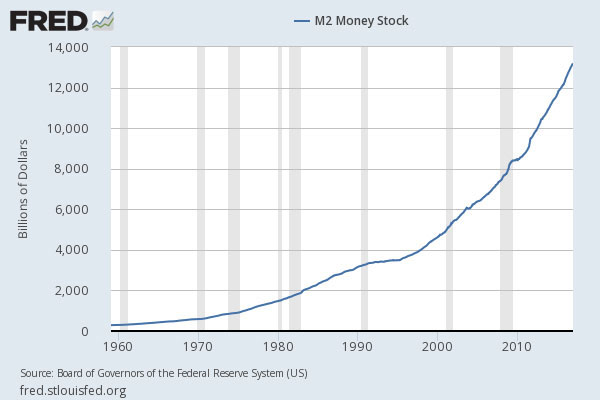
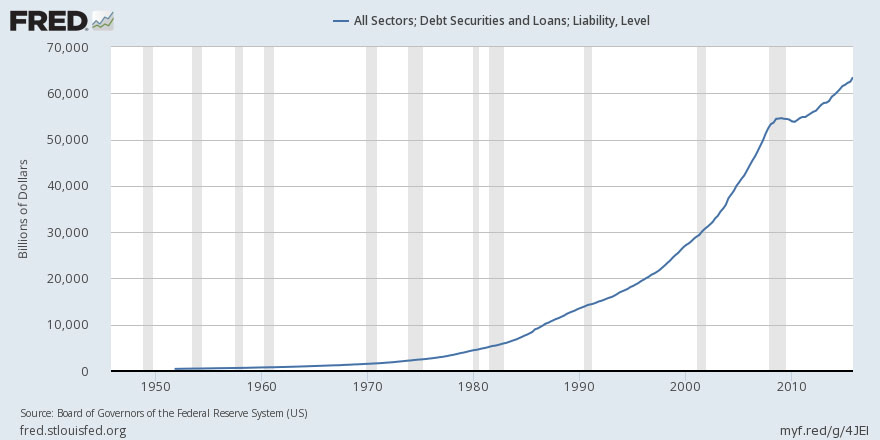
(9) GDP (Figure 7), money supply (Figure 8), and
all sectors debt (Figure 9) track one another. To increase the
GDP, the money supply must be increased; to increase the money
supply, either the Federal Reserve engages in quantitative easing,
trade balance goes positive or the debt outstanding increases.
Manufacturing continues to drive the GDP and services continue to raise its magnitude. Government spending -- budgeted and deficit -- and credit outstanding provide the added expenditures that keep the GDP growing and shape its dynamic appearance.
alternative
insight
february 8, 2017
HOME PAGE MAIN PAGE 
alternativeinsight@earthlink.net